It sounds so logical; an application goes into production, and agreements are made with the supplier regarding availability in terms of percentages within business and service hours. With the help of technical monitoring, you keep a close eye on things, and as long as all the lights are on green the supplier meets his obligations. But at some point users start to call in; the application has become impossibly slow or stopped working altogether. However, all the supplier’s lights are still showing green; he is complying with the SLA, so he has no problems. That’s because the SLA specifies nothing about the functioning of the entire chain, let alone about performance. Which means?
An SLA is not enough in itself
Unfortunately, we regularly encounter the above situation in practice. Agreements with relevant parties frequently go no further than a time percentage that a system must be ‘up’ and the maximum amount of time that an incident may last. These are factors that a supplier can easily measure with technical server monitoring and a ticket system.
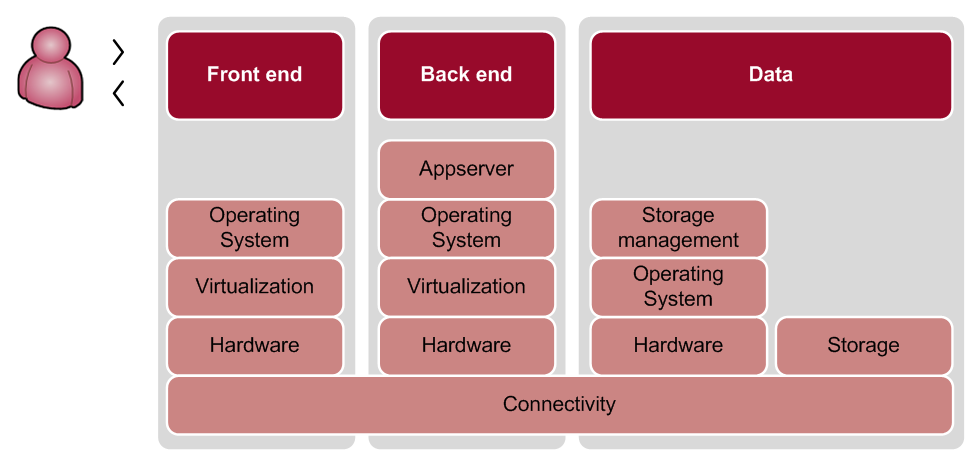
But when multiple suppliers or technologies are involved in the functioning of an application (hardware, communications, work stations, data storage), the likelihood of downtime in the chain as a whole increases. If components A and B are each allowed 10% downtime and the application’s functionality depends on both components being simultaneously available, the likelihood of downtime increases to A + B = 20%. The problem gets bigger as the number of dependencies increases.
System metrics are also not enough
When a server is working, it does not necessarily mean that the application running on it also works. The number of factors affecting the operation and performance of an application is many times greater than those that are actually monitored. We opt to monitor only the most basic system metrics (CPU, Disk I/O, network, etc.), even though we know this is not the complete list. Even more worrying is that we still monitor metrics whose underlying system sources are automatically up-scaled through virtualisation. It could be called a modern form of hedonism: control rooms are filled with dashboards with status indicators on green, while discontented users complain to the functional administrator. Are we really measuring the right things?
A better starting point: End-to-end monitoring
Obviously, the main thing we should want to monitor is the chain, end-to-end. This reveals every failure, wherever in the chain it occurs. If you do this from the end user’s perspective, the ultimate impact will also be immediately apparent. Secondly, it is important to link all relevant system metrics to the end-to-end monitoring for easy navigation to the cause of the incident. The idea is to start with end-to-end monitoring and then enhance it with relevant technical monitoring.

Why no IT manager can do without end-to-end monitoring
So why can’t an IT manager do without end-to-end monitoring? Because end-to-end monitoring makes for increased efficiency in all monitoring. After all, only those metrics that have been shown to affect the performance of an application are additionally monitored. Moreover, an incident always becomes visible. Through understanding of trends and rapid domain identification, the organisation can quickly move from reactive to proactive management.

