
Context-dependent
Is a 2-second response time fast? Or would 5 do just as well? At what point do end users start to complain, or do you start to lose money? Unfortunately, there is no simple answer to that. For some applications, the fastest technically achievable time is around 8 seconds, and that is fine in the perception of the end users.
Take, for example, logging in once per day to a VDI environment. But when it comes to a web store? In that case, research shows that 40% of visitors give up if the loading time lasts more than 3 seconds. In short: good response times depend on their context. The Apdex score allows you to quantify and qualify this context.
What is the Apdex score?
The Apdex (Application Performance Index) is an open industry standard for indexing performance.
In the ‘Apdex Alliance’, several organisations have jointly developed a formula, based on which the indexation takes place. The idea behind the Apdex is to enable one to measure whether response times meet the expectation of the end user, the business or the IT manager. These expectations have to be defined and converted into parameters in the formula.
How does it work?
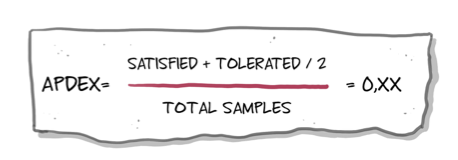
In the Apdex formula, response times are categorised into three bandwidths: ‘satisfied’, ‘tolerated’ and ‘frustrated’. For example:
- Does logging into application X take a maximum of four seconds? If so, that measurement is marked as satisfied and is assigned a value of 1 point.
- Does logging in take from 4.1 to 7 seconds? If so, that measurement is marked as tolerated and is assigned a value of half a point.
- Measurements of longer than 7.1 seconds are marked as frustrated. This measurement is assigned 0 points.
The number of points is divided by the number of measurements and plotted on a scale of 0 to 1. For example, 100 measurements have been made:
- 60 measurements were ‘satisfied’ and are assigned 1 point (60*1= 60)
- 30 measurements were ‘tolerated’ and are assigned 0.5 point (30*0.5= 15)
- 10 measurements were ‘frustrated’ and are assigned no points (10*0 = 0)
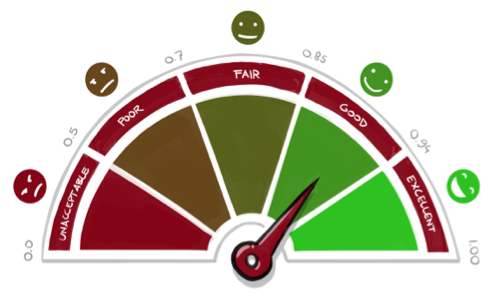
 Now a weighted performance index is calculated in the form of a single figure for the entire application for a specific moment. Now new possibilities arise. For example, the standardisation of satisfaction: with an Apdex value of 0.85, users can be regarded as ‘satisfied’. The aim, therefore, is to attain at least 0.85. In addition, it allows the satisfaction of users of different applications to be compared to each other. Moreover, the Apdex score can provide an important guidance resource for investment in specific, poorly performing applications.
 Adding context with parameters
To determine what the parameters of the various bandwidths of response times should be, it is important to involve the end user and/or business. For each transaction, there is discussion about which values are necessary, achievable and desirable. Then it is a simple matter to convert the measured performance figures into an Apdex figure per application or even for an entire chain.
For example, a doctor who makes use of an Electronic Patients Dossier. Not all of the transactions in this application have the same parameters:
- The log-in transaction takes place once per day. Both the doctor and IT have no problem with it taking between 6 and 10 seconds. Considering the dossiers that have to be loaded, there are also technical reasons for this. The parameters are set as follows:
- Satisfied: 1-7 seconds
- Tolerated: 7-10 seconds
- Frustrated: more than 11 seconds
- The transaction find patient is executed dozens of times per day. That means it is important for this to happen quickly, otherwise the doctor loses too much time from his already short consultation session.
- Satisfied: 1-3 seconds
- Tolerated: 4-5 seconds
- Frustrated: more than 6 seconds
The parameters are not obvious for all transactions or chains. Specialised parties can help to determine logical values based on experience, the type of application, research, and discussions with keys users and functional management.
Which means?
When the parameters have been set, these can be calculated automatically and are displayed on a dashboard or included in reports. As with many implementations, using Apdex is not just about the technical aspect. You also have to involve the people and processes from the start. People have to be aware of the impact of a low Apdex figure, and processes have to be configured in such a way that improvement programmes can be quickly deployed. The Apdex functions here as ‘glueware’ between people, processes and technology; the business, IT and the management all look to a single point of truth which is understandable and relevant for all parties.
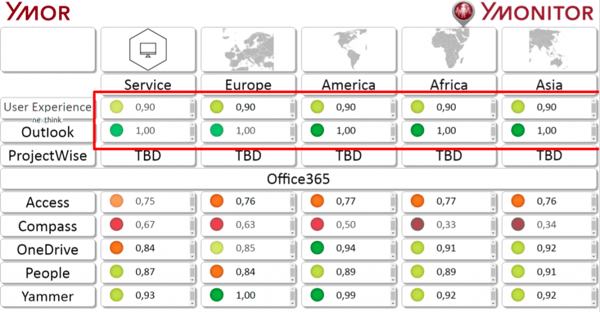
Dashboard that shows an Apdex value per location and application
Contact our experts!
More about this topic? Contact our experts to find out!